How to get a Search Report on Google Analytics when using Jumpseller
Using Google Analytics to know what kind of products your customers are looking for when they visit your store!
This documentation provides a comprehensive guide to the advanced reports available to Jumpseller merchants on the Advanced plan. These reports empower you to delve deeper into your store’s performance, analyze customer behavior, and gain valuable insights to optimize your business strategies.
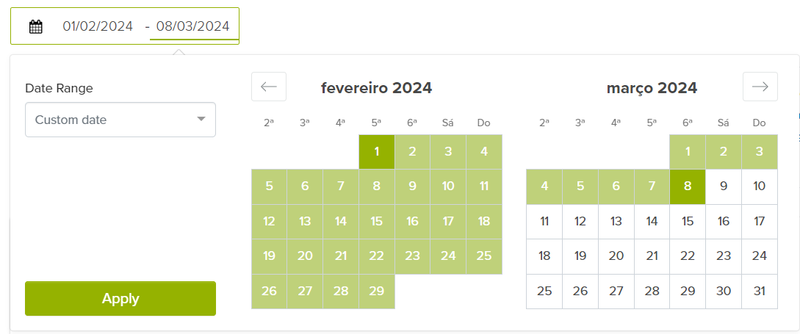
Almost all reports have this menu at the top, where you can select a date range from which to see the data. We provide you with two options:
Standard periods (last 7 days, last 30 days, last 90 days, quarter to date, Black Friday till Cyber Monday, and more).
Custom dates, where you can click on one date in the calendar to be the starting point, and again, to select the end point.
Here you can see the progression in time for a certain metric over the selected period, compared with the previous period.
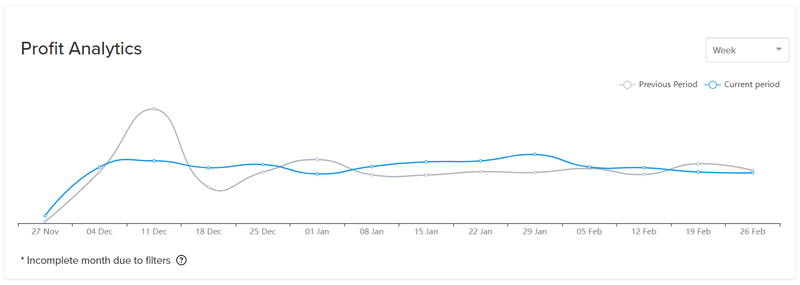
To drill up or down this graph, which can help identify spikes or drops in sales, you can select whether it is shown in days, weeks or months:
To help you analyze our tables, you can click on any of the column titles to order by it in the following order:
There’s also a visual indicator letting you know by which column the table is currently being ordered, as well as the order type (descending - down arrow, ascending - up arrow, no arrow, standard order).

By default, the table will be ordered by the most recent month / highest sales volume (depending on the report you are viewing)
At the top right corner of the report, you will see an “Export” button.

When clicked on, we will send to your email a link to download a CSV file with the data from the table report, based on the period you’ve selected for the report. Be aware that the download link expires after 7 days.

The primary goal of this report is to provide merchants with a focused and organized view of their product sales data, enabling them to quickly understand which products are being sold, manage stock replenishment, and make informed decisions to optimize their business operations and enhance customer satisfaction.
Note: Only products sold during the selected period are shown in this table.
| Column name | Description |
| Product | Names of the products sold during this period. |
| Status | Status of the products sold (available, not available, disabled) |
| No. of orders | Number of orders paid during this period. |
| Items sold | Number of products sold during this period. |
| Total | Total value of products sold during this period. |
Important: Before you start using this report you should set a cost for your products, otherwise you won’t be able to see the insights. Only sales made after you’ve set the product’s cost will be shown.
The primary goal of this report is to provide a comprehensive and data-driven analysis of a store’s product performance, profitability, and sales trends. By consolidating essential metrics and visualizations in a single report, it aims to empower store managers and decision-makers with actionable insights to optimize their operations and drive business growth.

The report starts with an overview of the main 3 metrics you can take into account at a glance:
Here you can see the progression in time of your profit for the selected period, compared with the previous period.

Depending on the date interval chosen, you will have certain data points with a “*” on them, indicating that they are incomplete (showing a weekly value but the interval started on a Wednesday).
The Profit by product table shows your gross profit per product for the selected date range. You can easily search by product, category, and interval of profit %. As well as ordering by each column by clicking on it.
Note: This report tracks your sales data based on the product details at the time of purchase. If you modify these details later, like renaming a product or changing its category, both the original and updated details might show up in the table depending on the date interval chosen.
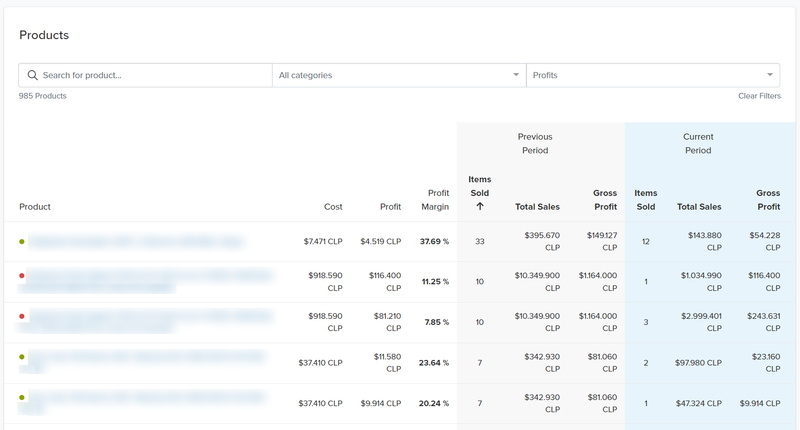
Reminder: Only products that had their cost set before they were sold will appear here. For this reason, you might notice a discrepancy between the net sales numbers shown in your sales report and the profit report. To get insights from your profit reports, you must add a cost per item to your products and wait for new sales.
For each product that had cost recorded at the time it was sold, you see the following information:
| Column name | Description |
| Product | Name of the product and a link to edit it |
| Cost | The value set on the cost field inside each product page |
| Profit | Price of sale the product - cost of the product - discounts |
| Profit margin | The profit margin on each product during this period. |
| Items sold | The number of times the product was sold during the selected period. |
| Total sales | The total value of the product sold in paid orders during this period. |
| Gross profit | The total profit made by the product during this period. It is calculated as (total sales value - Cost of the product * Number of products sold) |
Start by checking the profit margin column, there you’ll find 2 common occurrences:
Products that have a high-profit margin but aren’t sold much
These products have a lot of potential but they aren’t being sold as much as you would like, consider reducing their price / creating a promotion since you have a large margin to adjust.
Products that have a low-profit margin and are sold a lot
These products are your best sellers, if you can reduce the costs by even a bit it will have a great impact on your bottom line.
Filter by profit margin intervals to help you focus on highest/lowest profit margin products and compare them to find insights.
The primary goal of this report is to gain a comprehensive understanding of your customer base composition and the relative contributions of first-time (new) and returning (recurring) customers to your overall sales performance.
This insight is crucial for developing targeted strategies to optimize customer acquisition, retention, and long-term growth.
Important terminologies:
First time customers - Customers that have made their first paid order on your store. In rare cases, visitors may use different email addresses or phone numbers for two different purchases, as such, they will be counted as two first-time customers.
Returning customers- Customers that have made more than one paid order on your website.

The report starts with an overview of the main 4 metrics you should take into account at a glance:
Total Number of First-time customers- How many first-time customers did you have during this period.
First-time customers total sales - Total value of orders paid by first-time customers during this period.
Total Number of Returning customers- How many first-time customers did you have during this period.
Returning customers total sales - Total value of orders paid by returning customers during this period.
Here you can see the progression in time of your sales coming from first-time vs. returning customers for the selected period.
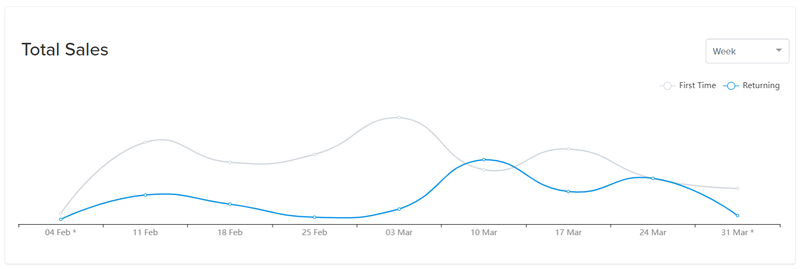
Depending on the date interval chosen, you will have certain data points with a “*” on them, indicating that they are incomplete (showing a weekly value but the interval started on a Wednesday).
The First-time vs Returning customers table shows how many sales each type of customer made during the selected date range.
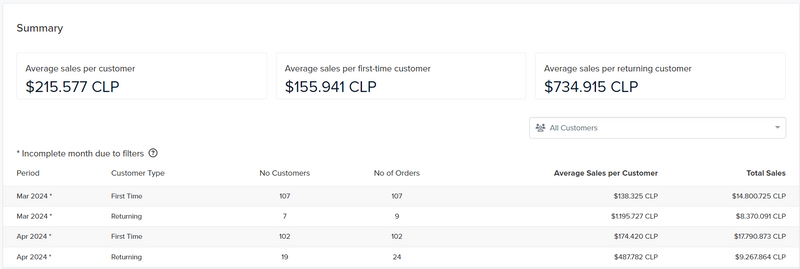
For each month that had paid orders, you see the following information:
| Column name | Description |
| Period | Time interval chosen broken down into smaller intervals. |
| Customer Type | Distinguishes between the type of customer the values being shown represent |
| Number of customers | Number of visitors that paid for an order during this period. |
| Number of orders | Number of paid orders during this period. |
| Average sales per customer | Average value of paid orders per customer |
| Total sales | The total value of the paid orders during this period. |
To help you focus on a specific type of customer, you can also filter by it. Click on the “All customers” field and select “returning” or “first-time customers”.
After you’ve selected it, only that type of customer will appear on the table. Select “All customers” to revert to the original table.
Here are a few suggestions we can give:
Start by checking the number of customers per type each month to understand whether it’s the returning or the first-timers that are bringing the most sales to your store.
Compare the “Average Sales per Customer” values between first-time and returning customers to assess if returning customers tend to spend more or less on average.
Look for trends or patterns in the data over multiple periods to understand changes in customer behavior and sales performance.
Combine insights from this table with other data sources or reports to gain a more comprehensive understanding of customer behavior and sales dynamics.
Look at the “No. of Customers” and “No. of Orders” columns to gauge the volume of customers and orders for each customer type during the specified period.
The primary goal of this report is to gain a comprehensive understanding of the channels from which your customer base is coming to help you decide where you need to invest more or reduce the budget.
This insight is important for developing targeted strategies to optimize customer acquisition, retention, and long-term growth.
Important terminologies:
Referrer Source - This represents the general category or origin of the traffic, such as search engines, social media, or direct visits. It gives you a high-level view of which channels are driving the most traffic to your store.
Referrer Name - This is a more specific breakdown within each source, identifying the exact platform or website (e.g., Google, Facebook, Instagram) that referred the customer. This detail allows for granular insights into which specific platforms are most effective.

The report starts with an overview of the main 3 metrics you should take into account at a glance:
Total Number of Orders - How many orders were created during this period. The percentage comparison at the top is based on the previous time period.
Top Referrer Source - Number of orders that came from the top referrer source.
Top Referrer Name - Number of orders that came from the top referrer name.
Here you can see the progression in time of your sales coming from different traffic sources for the selected period.
The number of labels/lines shown depends on the number of traffic sources with orders created for the selected period.

Depending on the date interval chosen, you will have certain data points with a “*” on them, indicating that they are incomplete (showing a weekly value but the interval started on a Wednesday).

Before showcasing the table there’s a summary with an overview of critical metrics you should take into account at a glance:
Cart conversion rate - Displays the overall cart conversion rate: (Total Number of orders paid/ Total number of Orders created). This tells you the average percentage of orders created that get paid.
Average sales per referrer name - Displays the overall average sales for each referrer name: (Total Sales Value / Total number of customers).
AOV per referrer name - Displays how much customers are spending on average per order overall: (Total Sales Value / Total Number of Paid Orders).
The Customer Acquisition table shows how many sales each type of traffic channel generated during the selected date range and a percentage change when compared to a previous period.

For each channel that had paid orders, you see the following information:
| Column name | Description |
| Referral source | Specific platform or website that referred the customers. |
| Referral type | Name of the general category or origin of the traffic (ex: search engines, social media, direct visits). |
| Number of orders | Number of orders created during this period. |
| Added to cart | Number of orders on the cart phase during this period. |
| Pending | Number of orders that are pending payment during this period. |
| Abandoned orders | Number of orders abandoned (didn’t get paid before expiring) during this period. |
| Paid orders | Number of paid orders during this period. |
| Cart conversion rate | Percentage of total orders that were paid for: (Number of Paid Orders / Number of orders created). |
| Total Sales | The total value of the paid orders. |
| AOV (Average Order Value) | How much customers are spending on average per order: (Total Sales Value / Total Number of Paid Orders). |
To help you focus on a specific type of customer, you can also filter by it. Click on the “All referrer types” field and select one of them to get a clearer view of specific traffic referral types.
After you’ve selected it, only that type of traffic referral type will appear on the table. Select “All referrer types” to revert to the original table.
Here are a few suggestions we can give:
Start by checking the referral source with the most paid orders, that channel should be prioritized when managing the marketing budget.
Look at the cart conversion rate to identify if there may be any potential bottlenecks in the purchase process. A significant drop-off may suggest a need to reduce the number of fields required in the checkout or an adjustment in the targeting.
Try to refine your targeting and messaging for traffic sources with low cart conversion rates. The customers coming from them may not be very inclined to make a purchase right away.
Consider increasing the budget of traffic sources with higher AOV, and lowering it (or at least reducing the target cost per acquisition) for the ones with lower AOV.
Look for trends or patterns in the data over multiple periods to understand changes in performance from different traffic sources.
Combine insights from this table with other data sources or reports to gain a more comprehensive understanding of customer behavior and sales dynamics.
Depending on the number of sales your store has, the reports will take longer to load. However, after it loads the first time in each session, it is much faster, so don’t worry if it takes longer than expected during the first time.
You can also contact us regarding the reports you have, so we can give you some guidelines on how to interpret your data best.
Start your free 7-day trial. No credit card required.